|
|
|
|
|
|
I've been running the magnetometer more or less uninterrupted from December 2011 until April 2015 (with the exception of a couple of small outages - one caused by hardware problem, and the second by a rat chewing through a data cable). On this page you can see near real-time plots of the data coming out. Plots are updated every 10 minutes or so. Time scale is in UTC.
The dominant pattern is the normal daily fluctuation of the magnetic field. This is a smooth wave with a period of 24 hours, peaking around 17:00 UTC. Superimposed on this daily pattern are two kinds of deviations. First, there are sharp jumps, caused by things moving around the magnetometer - bicycles, cars parked nearby, etc. There are also smoother bumps and dips - those are real changes in the magnetic field - minor or major magnetic storms.
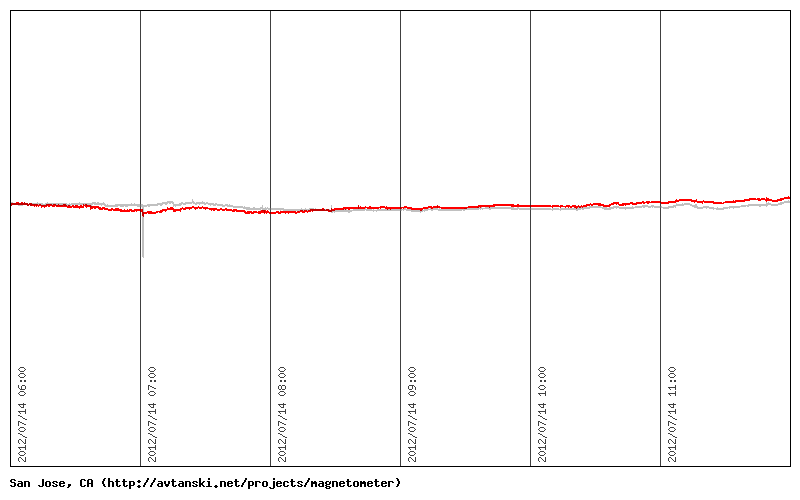
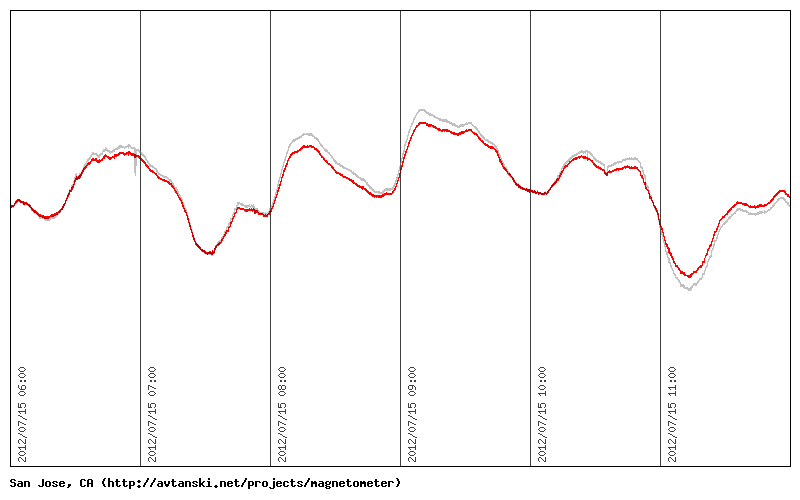
If you zoom on any of the images you will notice two traces on the graphic. One, in light gray, is the raw data, as it comes from the magnetometer. The other trace, in red, is the filtered data. The filtering algorithm attempts to remove or at least reduce the artificial noise caused by cars, bicycles, and so on.
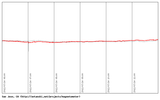
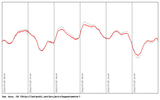
For an example of what you should be looking for, take a look at the two graphs to the right. The first one was recorded during the (local) night on July 14, 2012 while the Earth's magnetic field was quiet. The record from the next night, July 15, shows a moderate magnetic storm in progress.
|
|
|
|
|
|
|
|
