Serial Data Logger
with PIC microcontroller
| Main | Schematics | Software | Construction | Other Projects | ||||||||
|
Because of the distributed nature of this project, there are several pieces of software you will need.
You can get all of those from the code table on the right.
The following is a description of the software you will need.
The text below may contain a bit more information than strictly necessary -
you should be able to use everything without knowing anything anything about the way checksumming works or how the noise reduction algorithm operate,
but I'm including this too, just in case you want to do some customization.
If you need additional information, please email me - my address is at the bottom of each page.
Data capture and serialization The first piece of code is the program for the microcontroller ( logger.asm).
It is a very short assembly program that simply reads the microcontroller's analog input and sends out the same data in serial format.
Because the ADC operates with a 10-bit precision, each data sample point is serialized as two bytes (i.e. 16 bits). When the data is picked up on the other side of the serial connection, the receiver must figure out which is the high and which is the low byte. In order to help with this and to ensure some level of error correction, the microcontroller allocates 6 unused bytes for checksum, as shown below: 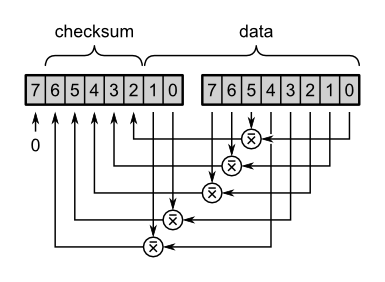 Each of the five checksum bytes are calculated as inverse-XOR of two data bits, as shown on the diagram. The last bit of the high-order byte is always set to 0. This encoding allows the receiver to synchronize on the data stream and provides some level of error checking. Storing the serialized data I wrote a simple Perl script for the purpose. The script reads the data from the serial port and records it in a file.
The data logging script is designed for a Linux (UNIX) computer - in case you want to run the data logger on a different OS, you might have to either adjust the script or write your custom program. If you do so, it might help you to store the data in the same format as this script does - this will allow the OS-independent data processing and visualisation scripts (described below) work with your file. The data is stored in the file by frames. Frame size is variable. Each frame is timestamped - this allows you, from the timestamps of two subsequent frames, to identify the exact time each sample was recorded. The format of the file is shown in the next diagram: 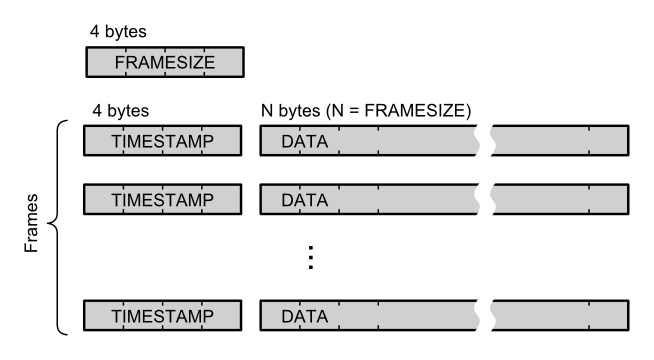 Timestamps and frame sizes are stored MSB first. Data inside each frame is stored byte-by-byte, as it comes from the logger via the serial interface. Because each sample consists of two bytes, and considering that occasionally a byte or two can be lost in transmission, it is obvious that a synchronization mechanism for interpreting the data in the frames is needed. This is achieved via the checksumming mechanism described in the previous section. If the checksum of two bytes do not match, the sample is considered bad data and an attempt to read the sequence from the next byte is made. This is repeated until the checksum matches, at which point synchronization has been achieved. The datlib.pl library can be used for reading data in this format.
Processing and visualisation of stored data So, you have your data logging system running, happily storing file after file of high-quality data. But what use is the data if you can't process and visualise it? I have some libraries and scripts that will let you do some basic editing and visualisation of your data. The clip script allows you to select part of your data.
For example, if you recorded 24 hours of data in a single file, you may want to split this into 24 one-hour long pieces and work on these separately.
The options of the clip script are described below:
After you've extracted the piece of data you need, you will probably want to visualise the data on a graph. To plot your data, use the draw script:
Filtering and Jump correction While using the data logger in one of my projects - a sensitive magnetometer - I had to find a solution of a very annoying problem. The magnetometer I built was for recording magnetic storms. Those are slow changes in Earth's magnetic field and can last for days. During this time, the magnetometer have to deal with a number of disturbances from local sources. For example, each time the neighbourhood kids parked their bicycle near our patio, the readings jumped this or that direction. Same thing happened when somebody opened the door of the refrigerator or pushed the outdoor furniture around. All these dirsturbances were presenting a very noisy environment in which the slight changes in the Earth magnetic field were lost. Fortunately, there was an easy way to solve those problems, without banning everybody from moving, or having to relocate to the middle of the Mojave desert. Most of those disturbances differ from the changes in planetary magnetic field by their speed. Somebody pushes a iron chair around - this is detected as a very fast shift in the direction of the magnetic field that takes place in the duration of a second or two, or a jump in the magnetometer readings, like this: 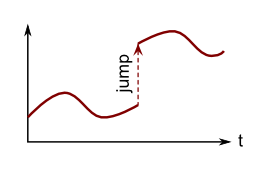 I added something I called "jump correction" to the data processing library. If jump correction is turned on, any sudden jumps are corrected for: 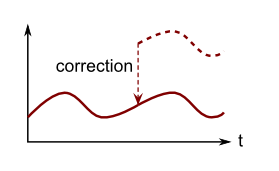 The precise speeds and thresholds for activation of the jump correction algorithm are controlled by the respective parameters, listed in the usage info for the draw script.
|
| |||||||||||||||||||||||||||||||||||||||||||||||||||||||||||||||||||||||||||||||||||||||||||||||||||||||||||||||||||||||||||||||||||||||||
| Main | Schematics | Software | Construction | Other Projects | ||||||||
 | ||||||||||||